June 16, 2026, (Inside AI) — When an AI agent stumbles in production, knowing it failed is trivial. The real challenge is uncovering why. Strands Evals SDK now automates that detective work, slashing diagnosis time from hours to minutes.
Beyond Scores: The Diagnosis Gap
Traditional evaluation spits out a single number: goal completion rate, tool accuracy, helpfulness. But a score drop from 85% to 70% only confirms a problem. It doesn't reveal which behaviors broke, distinguish root causes from symptoms, or guide where to fix—prompt or tool definitions.
Senior engineers typically inspect traces manually, correlating failures across hundreds of steps. That approach doesn't scale. Strands Evals Detectors automate this workflow, answering not just "how well?" but "why did it fail and how do I fix it?"
How Detectors Uncover Failure
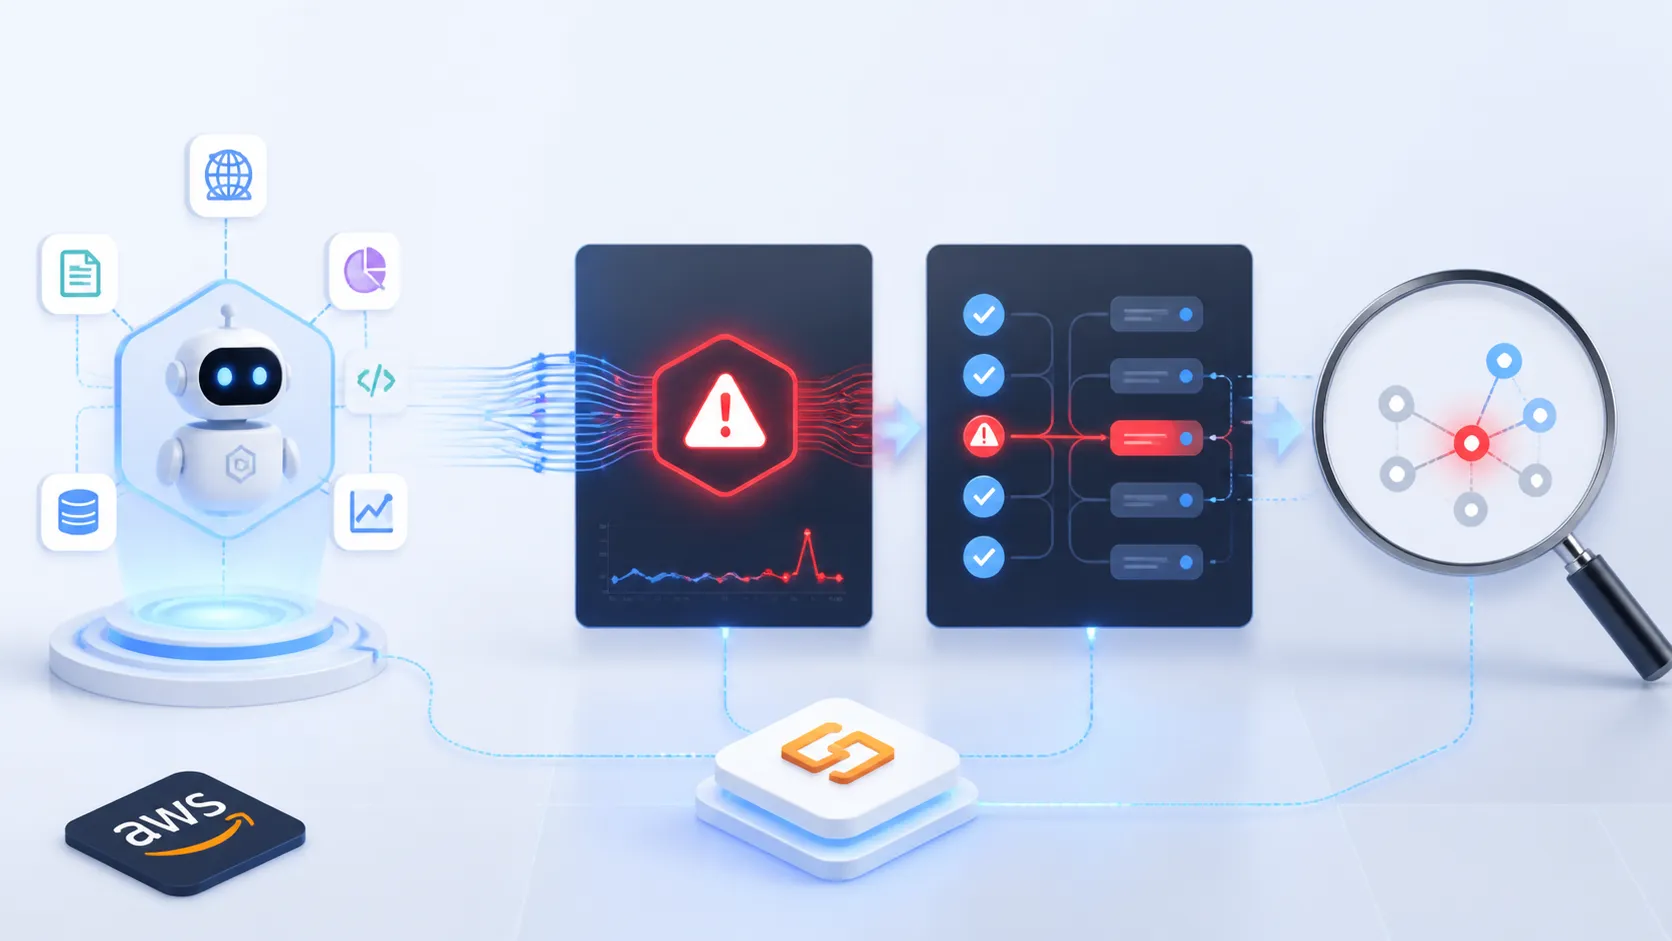
The pipeline operates in two LLM-powered phases. First, failure detection scans each span against a taxonomy of nine categories: hallucination, incorrect actions, orchestration errors, and more. It returns span location, categories, confidence scores, and trace evidence.
Second, root cause analysis traces causal chains. A single upstream mistake often cascades. This phase classifies failures as PRIMARY, SECONDARY, or TERTIARY, determines propagation impact, and generates fix recommendations categorized by system prompt or tool description.
For large sessions, the system uses a tiered strategy: direct analysis, failure path pruning, or chunked analysis with merge.
Diagnosis in Action
Consider a research agent asked to study AI's energy impact. It encountered tool configuration issues and degraded. In one pass, detectors flagged execution errors, hallucinations from "general knowledge," and orchestration deviations—each with independent confidence and evidence.
Adding root cause analysis revealed a tool schema error as the primary cause, with downstream hallucination as a secondary symptom. Fix recommendations targeted both: clarify the tool's documentation and add instructions for handling persistent failures.
A unified diagnose_session function combines both phases, returning deduplicated recommendations. From one call, teams get a prioritized list of changes.
Integrating into CI/CD Pipelines
Detectors attach to any experiment, automatically diagnosing failing test cases. Two trigger modes exist: on_failure (default) runs only when evaluators flag issues, keeping costs low for CI/CD. always runs on every case, useful for finding suboptimal paths in passing tests.
With this integration, a pipeline reports not just "3 tests failed" but why they failed and what to change. The feedback loop closes: define cases, run experiment, get scores and diagnosis, apply fixes, re-run.
Note: Detectors use Amazon Bedrock inference, incurring charges. Monitor usage in AWS Cost Explorer.
Production Diagnostics from CloudWatch
In production, agent traces live in Amazon CloudWatch Logs. The SDK fetches them directly, auto-detects the agent framework, and converts spans into a standardized format. This works with any framework exporting OpenTelemetry traces, not just Strands Agents.
Teams can also evaluate and diagnose historical sessions without re-running agents, or retrieve traces from Langfuse or OpenSearch.
Best Practices for Effective Diagnosis
Start with MEDIUM confidence for routine use. Use LOW for deep dives, HIGH for production monitoring. In CI/CD, use on_failure mode; schedule always mode weekly to catch hidden issues.
Fix primary failures first—secondary and tertiary issues often resolve automatically. Group recommendations by fix type to measure impact independently. Pass pre-detected failures to root cause analysis to avoid redundant detection.
Detectors close the loop between measuring and improving agent quality. By automating manual trace inspection, teams move from "test failed" to "here's what to fix" in minutes.